Search This Blog

Monday, 31 October 2011

Today's Daily Newsletter - Kedar Murdeshwar

31st October 2011,Monday

Sensex: 17705.01 (-99.79)
Nifty:5326.60 (-34.10)

Gold (MCX): 27209
USD-INR: 49.69

Dow:12231.11
Nasdaq:2737.15
CAC: 3282.08
DAX: 6243.65
Hang Seng: 19864.87

Buy Calls for Tommorow

JM Financial (18.80),Shree Ashta (6.65),Vijaya Bank (60.85)


Friday, 28 October 2011

Todays's market updates - Kedar K Murdeshwar

28th October 2011,Friday

Top Gainers of Nifty: Hindalco (10.57%),DLF (8.25%),Sterlite (7.94%) and RelInfra (7.93%)
Top Losers of Nifty:BPCL (-3.11%),Maruti (-1.68%),Sesa Goa (-.0.54%) and Bharti airtel (-0.52%)

Nifty 5360.70 (+158.90)
Sensex: 17804.80 (+515.97)

Gold MCX: 26789
USD:INR: 49.69

Dow: 12208.55
Nasdaq:2738.63
CAC:3364.40
DAX:6332.34

Good stocks to buy for tommorow: Ivrcl Infra (40.75),Moser Baer (27.90),GT Ofshore (123.60) and JP associates.

Thursday, 27 October 2011

Learn Technical Analysis

28th October 2011

Dear all,

Sorry for the Inconvinience caused to you as there were no updates on the blog for long.But from today we start the post again with a big Bang!

To start with I would like to announce a news to you.Now you can learn Technical Analysis in  avery short period (1 day or 2 days).Also you can learn Technical Analysis in Sessionwise breakups.( A new concept).

Suppose a person has done a basic course in Technical Analysis and want to learn in depth only on candlestick patterns.He can apply for the session only.If someone wants to learn only strategies,that can alos be offered at a Reasonable price.

If you want to know the price comment on this blog and I will mail you the details.

Learn the way you want,and not the way we teach!!!!!

Monday, 17 October 2011

Today's Market Update and Tomorow's overview

17th Oct 2011,Monday

Sensex: 17025.09 (-57.60)
Nifty: 5118.25 (--14.05)

Gold (MCX): 26857
INR-USD:  49.03

Dow: 11644.49
Nasdaq: 2667.85
DAX: 6017.84
CAC: 3234.10
Nikkie: 8880

The Nifty Pullers Today were Tata Motors (4.30%),Cairn (3.78%),Ambuja Cem (2.72%) and Maruti (2.57%)
The Nifty Draggers today Reliance (-3.88),pcl (-2.88),Sail (-2.92) and NTPC (-2.89)

Good Stocks to buy tommorow are as follows

JPInfratech (60.60),JBChePharma ( 79.80),DB Reality (58.40) and JP Power (37.80)

Muhurat Trading - Kedar Murdeshwar

17th October 2011,Monday


Mahurat trading is the auspicious stock market trading for an hour on Diwali (Deepawali), the biggest festival for Hindus.
Muhurat trading in the stock market happens for about an hour on Diwali day. Usually, this trading session is held in the evening. It is a symbolic ritual which has been performed for years.
Stock brokers' offices take on a distinctly ethnic look with neatly designed rangolis and innumerable diyas lined up to welcome Goddess Lakshmi. Muhurat trading is one of the many links the broking community retains with its rich past. The practice of muhurat trading has been retained and observed for ages. Usually, the Sensex closes on a higher note on the muhurat trading day. Most traders buy on this day.
With this, the traders on Dalal Street welcome the New Year on a positive note. The traditional muhurat trading on the day of Diwali still retains much significance for many traders. Many start the New Year with traditional ceremonies and pujas.
Muhurat trading is traditionally an occasion for an auspicious beginning to the traditional New Year.
Investors place token orders and buy stocks for their children, which are held for the long term and sometimes never sold. Traders normally book their intra-day profits, however small they may be.
For the trading communities of the north, the new financial year begins with Diwali. That is the reason puja is performed to accounts books and safes on Dhanteras as well as on Diwali day. A coin - which signifies wealth - is placed on the account books before the puja.
Stock brokers perform 'Lakshmi Puja' at the exchange and the customary muhurat trading takes place, where the Sensex invariably notches up a few points even in a bad market. It is believed that on the night of Lakshmi Puja, the Goddess comes to reside at the place of the puja. That is the reason why the traders and shopkeepers stay awake with lights burning all night.
The time of the muhurat trading is specified by the stock exchange. It is a part of the traditional rituals among the stock broking community. The event is believed to bring in wealth. A nominal trading time is allowed.
As Diwali also marks the beginning of the New Year, it is believed that muharat trading on this day brings in wealth and prosperity throughout the year. An auspicious beginning is thus made on the first day of the year.

Monday, 10 October 2011

Can we ever be Independant? - Kedar K Murdeshwar

10th October 2011,Monday

I received a call today from one of my friend Mr Sushil  (Stock broker).He was inviting me to a Seminar on Technical Analysis organised by some UK based analyst.I was just speechless for some time.Not because I got a free invitation to attend the Seminar,But because I was surprised to know that how easily do we get inspired by a foreign name.

This Mr sanjay was the same person who used to taunt me saying why do Indian Analysts (Especially of Mumbai) stay in suburbs and reside in 2 room kitchen.Why don't do they live in posh apartments?"Technical Analysis is all bullshit" was his statement when I tried to explain him the importance of Technical Analysis.

Coming back to the topic,I still wonder is it necessary to prefix a foreign country name before any word of Indian Origin to acknowledge its acceptance.If you ask any tom,dick and harry of Indian stock market (look!Even I am using Tom,Dick and Harry as my examples instead of Ram,Suresh or Ramesh) about the Market scenario out of 10,9 will say its depends on the FED rates (Ya you read it Right.Its FED and not RBI rates).They will have to analyze DOW and Nasdaq to predict Sensex and Nifty.

I have seen US,Russian,Uk and Chinese nationals selling our holy book in India.(And the Buyers are we Indians, who reside in the country of origin of Bhagvat Gita).We as modern youngsters never bothered to read Gita,till it was rediscovered by foreign nationals and they started propagating it to us again.

We get inspired by the Marketing books of Philip Kotler,but fail to realize our own India Potential.(Ambanis and Tata's.If they desire they themselves can write a thousand words on Marketing)

Most of us track the Dollar:Rupee rate.If someone asks us the status of the exchange rate,we say either the dollar has appreciated or Depreciated.We hardly say this using the word "Rupee".Though a Rupee symbol has been invented and accepted  by the Indian Government,we still while bargaining with vegetable or Fruit vendors use the word "Paanch ka Dollar" instead of Rs 5.Now that's the limit.

Sensex and Nifty has its own Identity and even the Indian Stocks otherwise they would not have been traded as ADR' s or GDR's in Foreign Market.I understand FII's have lots of Money Power,But we cant forget our Mutual Fund Industry which also has a strong AUM.

Lets Believe in Indian Economy.Lets believe Ourselves.Lets be independent

Sunday, 9 October 2011

Option Strategy - Synthetic Long Call

10th October 2011,Monday


Synthetic Long Call:Buy Stock Buy Put

In this strategy, we purchase a stock since we feel bullish about it. But what if the price of
the stock went down. You wish you had some insurance against the price fall. So buy a Put
on the stock. This gives you the right to sell the stock at a certain price which is the strike
price. The strike price can be the price at which you bought the stock (ATM strike price) or
slightly below (OTM strike price).
In case the price of the stock rises you get the full benefit of the price rise. In case the price
of the stock falls, exercise the Put Option (remember Put is a right to sell). You have capped
your loss in this manner because the Put option stops your further losses. It is a strategy
with a limited loss and (after subtracting the Put premium) unlimited profit (from the stock
price rise). The result of this strategy looks like a Call Option Buy strategy and therefore is
called a Synthetic Call!
But the strategy is not Buy Call Option (Strategy 1). Here you have taken an exposure to an
underlying stock with the aim of holding it and reaping the benefits of price rise, dividends,
bonus rights etc. and at the same time insuring against an adverse price movement.
In simple buying of a Call Option, there is no underlying position in the stock but is entered
into only to take advantage of price movement in the underlying stock.

Risk:Losses limited to stock price + Put Premium - Put Srike price

Harshad Mehta Stock Market Scam - Lets Know

10th October 2011,Monday

Harshad Shantila Mehta  was an Indian stockbroker. He is alleged to have engineered the rise in the BSE stock exchange in 1992. Exploiting several loopholes in the banking system, Mehta and his associates siphoned off funds from inter-bank transactions and bought shares heavily at a premium across many segments, triggering a rise in the Sensex. When the scheme was exposed, banks started demanding their money back, causing the collapse. He was later charged with 72 criminal offenses, and more than 600 civil action suits were filed against him. Mehta died in 2002 with many litigations still pending against him.

Mehta gradually rose to become a stock broker on the Bombay Stock Exchange and had an expensive lifestyle. He lived in a 15,000 square feet (1,400 m2) apartment, which had a swimming pool as well as a golf patch. By 1990, Mehta had risen to prominence in the stock market. He was buying shares heavily. The shares which attracted attention were those of Associated Cement Company (ACC). The price of ACC was bid up to Rs 10,000. When asked, Mehta used the replacement cost theory as an explanation. .
Through the second half of 1991 Mehta had earned the sobriquet of the ‘Big Bull’, because he was said to have started the bull run. On April 23, 1992, journalist Sucheta Dalal exposed Mehta's illegal methods in a column in The Times of India. Mehta was dipping illegally into the banking system to finance his buying. The authors explain: “The crucial mechanism through which the scam was effected was the ready forward (RF) deal. The RF is in essence a secured short-term (typically 15-day) loan from one bank to another. Crudely put, the bank lends against government securities just as a pawnbroker lends against jeweller. The borrowing bank actually sells the securities to the lending bank and buys them back at the end of the period of the loan, typically at a slightly higher price.” It was this ready forward deal that Mehta and his accomplices used with great success to channel money from the banking system.
A typical ready forward deal involved two banks brought together by a broker in lieu of a commission. The broker handles neither the cash nor the securities, though that wasn’t the case in the lead-up to the scam. “In this settlement process, deliveries of securities and payments were made through the broker. That is, the seller handed over the securities to the broker, who passed them to the buyer, while the buyer gave the cheque to the broker, who then made the payment to the seller. In this settlement process, the buyer and the seller might not even know whom they had traded with, either being known only to the broker.” This the brokers could manage primarily because by now they had become market makers and had started trading on their account. To keep up a semblance of legality, they pretended to be undertaking the transactions on behalf of a bank.
Another instrument used was the bank receipt (BR). In a ready forward deal, securities were not moved back and forth in actuality. Instead, the borrower, i.e., the seller of securities, gave the buyer of the securities a BR. As the authors write, a BR “confirms the sale of securities. It acts as a receipt for the money received by the selling bank. Hence the name - bank receipt. It promises to deliver the securities to the buyer. It also states that in the mean time, the seller holds the securities in trust of the buyer.”
Having figured out his scheme, Mehta needed banks which issued fake BRs, or BRs not backed by any government securities. “Two small and little known banks - the Bank of Karad (BOK) and the Metropolitan Co-operative Bank (MCB) - came in handy for this purpose. These banks were willing to issue BRs as and when required, for a fee,” the authors point out. Once these fake BRs were issued, they were passed on to other banks and the banks in turn gave money to Mehta, assuming that they were lending against government securities when this was not really the case. This money was used to drive up the prices of stocks in the stock market. When time came to return the money, the shares were sold for a profit and the BR was retired. The money due to the bank was returned.
The game went on as long as the stock prices kept going up, and no one had a clue about Mehta’s modus operandi. Once the scam was exposed, though, a lot of banks were left holding BRs which did not have any value - the banking system had been swindled of a whopping Rs 4,000 crore. When the scam was revealed, the Chairman of the Vijaya Bank committed suicide by jumping from the office roof. He knew that he would be accused if people came to know about his involvement in issuing cheques to Mehta.
Mehta made a brief comeback as a stock market guru, giving tips on his own website as well as a weekly newspaper column. This time around, he was working with owners of a few companies and recommended only the shares of those companies. This game, too, did not last long.[1]
By the time he died, Mehta had been convicted in only one of the many cases filed against him.

Friday, 7 October 2011

Indices Weekly Updates - Kedar K Murdeshwar

8th October 2011,Saturday

CNX 500 (3913.95): There is a Hammer Formation on the weekly chart Indicating that the Index can move up in the coming week,

CNX Bank (9038.25)/;The index was drastically down this week but recovered a lot later in the week.

CNX Energy (7707.25):On the weekly chart has made a higher bottom but a lower top and a lower close.

CNX FMCG (9896.65): Same case of Lower top and Higher Bottom.

CNX IT ( 5640.95):Made a sort of Harami Pattern

CNX Infra (2558.90): Doji pattern on the weekly chart

CNX Junior Nifty (9518.90):Looks highly bearish

CNX MNC (4610.50): Missed its Hammer pattern because of a small shadow at the top.

CNX Midcap (6894.15):Extremely Bearish

CNX PSE (3028.25):Formation similar to a spinning Bottom on the weekly chart

CNX PSU Bank (3020.40):Extremely Bearish

CNX Reality (234.60): Was Bearish but recovered a lot.may be positive next week


Stock Market Weekly Updates - Kedar K Murdeshwar

8th October,2011 Saturday

Sensex: 16232..54 (+ 440.13)
Nifty: 4888.05 (136.75)

Gold (MCX): 26264 (- 246)
INR-USD: 49.13 (-0.02)

Dow: 11103.12
Nasdaq: 2479.35
CAC: 3095.56
Hang Seng: 17707
DAX: 5675.70
Nikkie: 8606

Nifty Support levels for Next Week are 4770,4652 and 4575
Nifty resistance levels for next week are 4964,5040 and 5158

Sensex Support levels for next week are 15869,15506 and 15267
Sensex Resistance levels for Next week are 16471,16710 and 17073

Sensex has formed a Doji formation on weekly chart.

The Difference between Sensex and Nifty this week was the Nifty opened at 4874 but closed higher at 4888.05.Sensex opened at 16255 and closed lower at 16232

Wednesday, 5 October 2011

Today's Market Updates and Friday's Overview - Kedar K Murdeshwar

6th October 2011,Wednesday


Sensex: 15792.41 (-72.45)
Nifty: 4751.30 (-20.85)

Gold (MCX): 25850 (-50)
INR-USD: 49.17

Dow: 10808.71
Nasdaq: 2404.82
Hanseng: 16250.27
DAX: 5366.15
CAC: 2925

Top Gainers of Nifty Today: Jp associates (4.52%),DLF (3.34%) and Sun Pharma (2.37%)
Top Losers of Nifty Today:SBI (-4.21%),Hindalco (-3.92%) and BHEL (-3.40%)

Nifty Support levels for Friday are 4720,4687 and 4633
Nifty resistance levels for Friday are 4807,4860 and 4894

Good Stocks to Buy for Friday are Ramco (73.50) Target:76,Sun Tv (232.50) Target:237,Areva (226.05) Target:232 and DLF (207.20) Target:210

Dusshera and Stock Market - Kedar K Murdeshwar

5th October 2011,Wednesday

Dusshera is a Festival denoting Victory of Good over Evil.

This celebration starts from Navratri and ends with the tenth day festival of “Dussehra”. Navratri and Dussehra is celebrated throughout the country at the same time, with varying rituals, but with great enthusiasm and energy as it marks the end of scorching summer and the start of winter season.

It is also called “Vijayadashmi” as this day marks the victory of Lord Rama over Ravana.

So on this Auspicious day of Dusshera lets burn the ten faces of the Stock Market Ravan.

1st Face: Greed

2nd Face: Fear

3rd Face: Impatience

4th Face: Gamble

5th Face: Heavy Trading

6th Face: Inflation

7th Face: High Interest Rates

8th Face: US Dependence

9th Face: Bear

10th Face: Poor Analysis

Tuesday, 4 October 2011

Daily Market Updates

4th October, 2011 Tuesday

Markets Today and Tommorow


Sensex: 15864.86 (-286.59)
Nifty: 4772.15 (-77.35)

Gold (Mcx): 26720 (+164)
INR-USD: 49.31

Dow Jones: 10655..30
Nasdaq: 2335.83
Hangseng: 16250.27
CAC: 2841.75
DAX: 5181.96

Nifty Top Gainers: Maruti (2.57%),L&T (2.11%) and Wipro (2.06%)
Nifty Top Losers: Tata Motors (-4.75%),Icici Bank (-4.50%) and M&M (-4.31%)

Nifty Support levels for Tomorow are 4710,4648 and 4568
Nifty Resistance levels are 4851,4931 and 4993

Buy Calls for Tomorow

Gael (24.15) Target 26
Koutons (27.70) Target 29 (I had given this call yesterday also)
Ramco Ind (41.50) Target 43


Cheap Stocks - Kedar K Murdeshwar

4th October 2011,Tuesday

Cheap Stocks:Stocks that are in the Range of Rs 5 to Rs 10 with volume more than 50k

KSOils (9.75):Looks Bearish for tomorrow.The major support is 8.93 and Major Resistance is 11.90.Volumes too are continuously Falling for last 4 days

VikashMet (9.75): Tried to pick itself up in the Intraday but ultimately closed below.The previous day's candle is a Doji and a close above this Doji high van push the stock upwards

FutureEvent (9.00):Looks Beaish.May push up only when it crossed the doji top of the previous day

IndoSolar (9.00): Indosolar was positive today The scrip closed at its High.Looks good for tomorrow

LML (8.60):LML closed down today.The resistance of 8.80 is not letting the scrip to go up.

DCW (8.55):Stay away.Is very bearish

Smpl (6.90):The stock can show upward movement only when it crosses the doji high of 7.10.

ShreeAshta (5.65): The scrip ended positive.But no need to get very happy as the Doji high of 5.70 is very crucial.


Moving Average Report - Kedar K Murdeshwar

4th October,2011 Tuesday

Stocks that have Crossed below 200 day moving Average today are as follows

IndusindBank (246.70),Glenmark (302.90),Godrej Indus (188),Omaxe (134.60) and Jubiliant Food (671.75)


Stocks that have Crossed below 100 day moving Average today are as follows

Ashok Leylend (24.90),Delta Corp (95.70),Mundra port (148.75) and Usher Agro (121.75)

Hanging Man - Bearish pattern - Kedar K Murdeshwar

4th October 2011,Tuesday

HANGING MAN


If the above pattern occurs after an uptrend,it is referred to as HANGING MAN. Basically this is reversal pattern, and the scrip or index can come down after the formation of the pattern.
The body of this pattern is small and there is no upper shadow (high).It has only a long Lower Shadow (low).The more longer the shadow,the more the reliability of the pattern. Irrespective of the color of the candle,the Hanging man  pattern has significance and is a signal that the market may go down. Still,it has been observed that,the red hanging man is a more confirm signal. 
Usually,one will see this patterns formed at major market tops.


Hammer - Bullish pattern - Kedar K Murdeshwar

4th October 2011,Tuesday

HAMMER


HAMMER

If the above pattern occurs after a downtrend,it is referred to as HAMMER. Basically this is reversal pattern, and the scrip or index can go up after the formation of the pattern.
The body of this pattern is small and there is no upper shadow (high).It has only a long Lower Shadow (low).The more longer the shadow,the more the reliability of the pattern. Irrespective of the color of the candle,the Hammer pattern has significance and is a signal that the market may go up. Still,it has been observed that,the green hammer is a more confirm signal. 
Usually,one will see this patterns formed at major market bottoms.

In the Given below Daily Chart of IDFC,a Hammer can be seen.


Monday, 3 October 2011

Half Century - Kedar K Murdeshwar

4th October 2011,Tuesday

Starting this Blog was my inner motivation and Desire.But to continue writing articles and updating this blog on a regular basis was actually a monotonous job.but thanks to all my reader friends who visit my blog regularly,i get motivated each day to write up more interesting things on this blog.

And Today,I have completed 50 posts on this Blog within a single month.So just want to celebrate this Success with you all.The feeling is same as making a fastest half century in Cricket.

Thanks a Ton my Readers!

World's Cheapest Tablet Computer

4th October,2011 Tuesday


The world's cheapest tablet computer, which will be unwrapped on Wednesday, will go on sale in India starting December, the maker of the device has said.

Created for use by students, the tablet will first be made available to colleges at Rs 1,750 apiece ($35) although it costs Rs 3,000 to produce. The difference will be subsidised by the government as part of an ambitious plan to make information and communication technologies an integral part of education.

The tablet, will run on Google's Android platform, with WiFi connectivity for internet access and cloud storage. It will have 256 MB of RAM, a 2GB SD memory card, a 32 GB expandable memory slot and two USB ports.

A Canadian of Indian descent, Suneet Singh Tuli, the chief executive of the company making the device, declined to disclose its retail price, but said it will cost as much as "a vegetarian meal for two at a five-star hotel in Delhi".

Tuli is the founder of Datawind, a UK-based company which also makes the PocketSurfer, a handheld device to surf the web.

"We wanted to show the world when China can break price points, India can do it better," Tuli said.

The cheapest tablets available globally are at about $99 for an HP TouchPad and $199 for Amazon's Kindle Fire. In India, tablets currently start from $99 for Pepper, a tablet launched last month by Devraj group of companies. The Wespro ePad is available at Rs 7,000.

Trendlines Trade With Perfection

04th october,2011 Tuesday

Trendlines:While doing a deep study and analysis on the various indicators and oscillators,i came across these simple logical lines called as Trendlines.If a Novice to Technical Analysis,understands the concept of Trendlines and learns to draw trendlines with perfection,there is practically no need for him to rely heavily on all other technical indicators.That's the beauty of Trendlines!

A trend line is formed when you can draw a diagonal line between two or more price pivot points. They are commonly used to judge entry and exit investment timing when trading securities.

A trend line is a bounding line for the price movement of a security. A support trend line is formed when a securities price decreases and then rebounds at a pivot point that aligns with at least two previous support pivot points. Similarly a resistance trend line is formed when a securities price increases and then rebounds at a pivot point that aligns with at least two previous resistance pivot points.

Trendlines can be Drawn on daily,Weekly and Even Intraday Charts depending upon the trader/investor time horizon.

In the Given Below daily chart of Rel Capital,it can be clearly seen that the stock was moving in a rising trend touching the upward sloping trendline.Once this trendline was breached on the downside,the stock witnessed a steep fall.It crossed the trendline at the price of 520 and made a bottom of 320.

Nifty Daily Updates - Kedar K Murdeshwar

3rd october 2011,Monday

Nifty: 4849.50 (-93.75)
Sensex: 16151.45 (- 302.31)

Gold (MCX): 26490 (+459)
INR-USD: 49.44 (+0.42)

Dow Jones: 10913.38 (-2.16%)
Nasdaq: 2415.40 (-2.63%)
CAC: 2921.33 (-2.03%)
Hang Seng: 16822.15 (-4.38%)

The Week and This Month opened on a lower note today.Nifty tried to recover in the end but still ended in negative.

The Top Gainers in Nifty were Bpcl (4.38%),RPower (2.08%) and Rel Capital (1.95%)
The Top Losers in Nifty were DLF (-8.77%),Jindal steel (-6.77%) and Hindalco (-5.63%)

Market Overview for Tomorow (4th October 2011)

The Support levels for Tomorow are 4828,4798 and 4772
The Resistance levels for tOmorow are 4883,4908 and 4938

Good Stocks to Buy Tommorow

Koutons (26.75) Target:29
SimplexInf (236.95) Target:242
Hind Petro (376.10) Target:382
EduComp: (243.95) Target:250

Warren Buffet Quotes - Kedar K Murdeshwar

3rd October 2011,Monday


You are neither right nor wrong because the crowd disagrees with you. You are right because your data and reasoning are right.

Never invest in a business you cannot understand.

Unless you can watch your stock holding decline by 50% without becoming panic-stricken, you should not be in the stock market.

Stop trying to predict the direction of the stock market, the economy,Interest rats or elections.

Be fearful when others are greedy and greedy only when others are fearful.

It is optimism that is the enemy of the rational buyer.

As far as you are concerned, the stock market does not exist. Ignore it.

It is more important to say "no" to an opportunity, than to say "yes".

Buy a business, don't rent stocks.

An investor should ordinarily hold a small piece of an outstanding business with the same tenacity that an owner would exhibit if he owned all of that business.

Always invest for the long term.

Biggest Intraday Falls - Kedar Murdeshwar

3rd October 2011,Monday

Jul 6, 2009: The Sensex ended with a loss of 869 points at 14,043 following the Union Budget announced this afternoon. The index had opened in the green and gained 184 points to touch a high of 15,098. However, the Union Budget did not go down well with the investors and the Sensex started slipping in noon trades. Thereafter the index crashed to a low of 13,959 - down 1,139 points from the day's high.
 
Jan 22, 2008: The Sensex saw its biggest intra-day fall on Tuesday when it hit a low of 15,332, down 2,273 points. However, it recovered losses and closed at a loss of 875 points at 16,730. The Nifty closed at 4,899 at a loss of 310 points. Trading was suspended for one hour at the Bombay Stock Exchange after the benchmark Sensex crashed to a low of 15,576.30 within minutes of opening, crossing the circuit limit of 10%.
 
Jan 21, 2008: The Sensex saw its highest ever loss of 1,408 points at the end of the session on Monday. The Sensex recovered to close at 17,605.40 after it tumbled to the day's low of 16,963.96, on high volatility as investors panicked following weak global cues amid fears of the US recession.
 
January 18, 2008: Unabated selling in the last one hour of trade saw the index tumble to a low of 18,930 - down 786 points from the day's high. The Sensex finally ended with a hefty loss of 687 points (3.5%) at 19,014. The index thus shed 8.7% (1,813 points) during the week. The NSE Nifty plunged 3.5% (208 points) to 5,705.
 
December 17, 2007: A heavy bout of selling in the late noon deals saw the index plunge to a low of 19,177 - down 856 points from the day's open. The Sensex finally ended with a huge loss of 769 points (3.8%) at 19,261. The NSE Nifty ended at 5,777, down 271 points.
 
November 21, 2007: Mirroring weakness in other Asian markets, the Sensex saw relentless selling. The index tumbled to a low of 18,515 - down 766 points from the previous close. The Sensex finally ended with a loss of 678 points at 18,603. The Nifty lost 220 points to close at 5,561.
 
October 18, 2007: Profit-taking in noon trades saw the index pare gains and slip into negative zone. The intensity of selling increased towards the closing bell, and the index tumbled all the way to a low of 17,771 - down 1,428 points from the day's high. The Sensex finally ended with a hefty loss of 717 points (3.8%) at 17,998. The Nifty lost 208 points to close at 5,351.
 
August 16, 2007: The Sensex, after languishing over 500 points lower for most of the trading sesion, slipped again towards the close to a low of 14,345. The index finally ended with a hefty loss of 643 points at 14,358.
 
August 01, 2007: The Sensex opened with a negative gap of 207 points at 15,344 amid weak trends in the global market and slipped deeper into the red. Unabated selling across-the-board saw the index tumble to a low of 14,911. The Sensex finally ended with a hefty loss of 615 points at 14,936. The NSE Nifty ended at 4,346, down 183 points. This is the third biggest loss in absolute terms for the index.
 
April 02, 2007: The Sensex opened with a huge negative gap of 260 points at 12,812 following the Reserve Bank of India decision to hike the cash reserve ratio and repo rate. Unabated selling, mainly in auto and banking stocks, saw the index drift to lower levels as the day progressed. The index tumbled to a low of 12,426 before finally settling with a hefty loss of 617 points (4.7%) at 12,455.
 
May 18, 2006: The Sensex registered a fall of 826 points (6.76%) to close at 11,391, following heavy selling by FIIs, retail investors and a weakness in global markets. The Nifty crashed by 496.50 points (8.70%) points to close at 5,208.80 points

Sunday, 2 October 2011

Morning Update Stock Market - Kedar Murdeshwar

3rd October,2011 Monday

Nifty opened down with a gap today.Meanwhile Nifty has filled the up gap created on 27thSept,2011.Maybe that was the sole reason for the Nifty to open down with a gap.Today 4827 will act as a Major support.

On the Monthly chart it can be seen that Nifty is continuously falling down for last 3 months.It is trying to take support at 4777.This figure is crucial as it is a 38.2% retracement drawn from the bottom of 2252 (Oct 2008) to the top of 6338 (Nov 2010).Nifty will try to take support at this crucial level.If this Level is breached ie if Nifty gives a close below this level in October,god save Nifty then.

Spinning Doji Bottoms - Kedar K Murdeshwar

3rd October,2011 Monday

Spinning Doji Bottoms:These are Reversal patterns and formed after a downtrend.The Stock or the index is expected to rise after the formation of Spinning Bottoms.

In the Given below Intraday chart of Hero Honda one can see the Formation of Spinning Bottoms and the stock shooted to 2018 from 1939 in just 2 Trading hours


Saturday, 1 October 2011

Mahatma Gandhi's Quotes in Stock Market By Kedar Murdeshwar

1st October,2011 Saturday

Mahatma's quotes can be related to current Stock Market Scenario

Freedom is not worth having if it does not include the freedom to make mistakes.
--Its no use trading if you never make loss.Losses are allowed,but you should try to minimise them with proper Analysis.--

Whatever you do will be insignificant, but it is very important that you do it.

 -- Its not necessary that you must have huge Equity capital with you to trade or you should be a millionaire to invest in Stock Market.But you should invest a small proportion of your accumulated wealth in Stock market in today's time of inflation or Gold.Don't keep on thinking how much will I get,if I invest so less.start Investing early in small amounts but start.--


An eye for an eye makes the whole world blind
-- Avoid Revenge Trading.Just because you were not able to make profit in one particular scrip,its foolish to overtrade or over invest in the same scrip to take revenge of that stock.Ultimately you will lose everything.--

You must be the change you want to see in the world
-- Don't expect the Market to be perfect.The market will be perfect when you invest wisely with Proper Analysis.--


Stock Market Jokes

1st october,2011 Saturday


My broker and I are working on a retirement plan. Unfortunately, it's his!

A long term investment is a short term investment that failed.

It was so cold today I saw a stockbroker with his hands in his own pockets

A market analyst is an expert who will know tomorrow why the things he predicted yesterday didn't happen today!

Momentum Investing: The fine art of buying high and selling low.
Value Investing: The art of buying low and selling lower

The best time to buy anything is last year.
The market is weird. Every time one guy sells, another one buys, and they both think they're smart.
Economics is extremely useful as a form of employment for economists

Ask five economists and you'll get five different answers (six if one went to Harvard).

Economics is the painful elaboration of the obvious.

I asked an economist for her phone number....and she gave me an estimate.

An economist is someone who gets rich explaining others why they are poor.

Friday, 30 September 2011

NIFTY Weekly Update - Kedar K Murdeshwar

1st October,2011 Saturday

Nifty:Nifty closed 1.55% up from the previous close.(ie 75.50 points up).Though it made a formation of Lower top and lower bottom from the previous week,it managed to give a close above previous week.The Volumes are Continuously Falling for the last 4 weeks.

Given below are the Support & resistance levels for Next week

Nifty Support: 4792,4642 and 4526
Nifty Resistance:5059,5175 and 5326

Junior Nifty Support: 9643,9463 and 9290
Junior Nifty Resistance: 9995,10168 and 10347

Cnx Bank Support: 9193,8918 and 8670
Cnx Bank Resistance: 9716,9963 and 10238

Stocks that can be bought for next week

BEL (1534.10) Target 1560,Cummins India (414.30) Target 425,Power Grid (98.45) Buy above 99 and Target is 100,Sesa Goa (200.55) Target 208.


DOJI Formation on Weekly Chart - Kedar K Murdeshwar

1st October,2011 Saturday

Candlestick Formations on weekly Charts and its Importance

DOJI Formation:The Pattern of Indecision.If the Stock gives a close above the doji's high on the next candle the stock can rally up.

In the Given below scrips a Doji has been formed on the weekly chart.If the next week gives a close above this DOJI's High there are chances that the stock may rally.

Ackruti (190.05)

Advanta:A doji was formed in the previous week ended 23rd Sept.And the stock gave a close below the doji's low indicating Bearishness.

Asahi India (67)

Ashok Leyland (26.10)

Boshl Ltd (7051.20)

CESC (277.60)

CMC (829.55)

ELgieEquip (70.85)

GujFluoro (538.20):In fact there is a formation of Doji Spinning Tops.,Beware of this pattern.The stock can come down.

Gujrat Gas (431.05),Himmat Siede (33.50),Indswift lab (85),Infotecent (115) and NHPC (23.50)


Thursday, 29 September 2011

Daily Market Update and Overview for 30th Sept 2011

29th Sept,2011 Thursday

Sensex: 16698.07 (252.05 points up)
Nifty: 5015.45 (69.55 points up)

MCX Gold: 25700 (up by 27)
INR:USD: 49.18

Dow:  11010.90
Nasdaq:  2491.58
CAC: 3012.46
Hang Seng: 18011.06
DAX: 5574.48
FTSE: 5192

Nifty was up today but may face resistance at 5046 and 5059 in intraday tomorrow.These are immediate tough resistance levels.

Nifty Gainers: JP Associate (7%),Kotak Bank (3%) and Infy (3%)
Nifty Losers: Sesa Goa (-2.22%),LT (-2.19%) and Rel Capital (-2.15%)

Overview for tomorrow (30th Sept,2011 Friday)

The Support Levels for Nifty for Tomorrow are 4937,4857 and 4809.
The Resistance levels for Nifty are 5065,5114 and 5193

Stock Recommendtations for Tomorrow are as follows

Buy HSIL.Target for Tomorrow 183 and 190
Buy Bom Dyeing.Target for Tomorrow 390
Buy Alok Textile.Target 20
Buy JP Power.Target 36
Buy Tulip.Target for Tomorrow 170


Wednesday, 28 September 2011

Sector impacts of fuel price hike

29th September,2011 Thursday
Sector impacts of fuel price hike

1. Oil marketing companies
Who gets to encash the price hike? It's none other than OMCs like IOC, BPCL, HPCL, who are the direct beneficiaries of the hike. The so called bad news for general public is excellent news for these companies in the short to medium term.

2. Banking and automobile companies
As fuel price hike news is a dampener for vehicle buyers (especially four wheelers), in the short run there is a decrease in the demand of luxurious and fuel inefficient vehicles. This decrease in demand in turn reduces the loan growth of banking sector

3. Alternative fuel companies
A company which produces alternative fuel sources like Indraprastha Gas Limited becomes hot favourites in such times. It's clear that conventional fuel prices are bound to increase in future; alternative fuel generating companies are going to be the winners in the long run.

4. Cement, steel companies
The sectors which are heavily dependent on transportation – and hence fuel oil -- are negatively impacted in short term especially during the rainy season as they are not able to pass on the additional cost to the customers because of reduction in demand.


WORLD HEART DAY SPECIAL - BY KEDAR K MURDESHWAR

29th Sept 2011 Thursday (World Heart Day Special)


My dear friends,I understand that the markets have become too much Volatile.Every other day we hope to see the markets up,and we find that the market falls and also erodes our wealth.(hard earned money from the stock market).

Many of us are mature enough to understand that these ups and down;s are an indispensable part of Stock market.But on the other there are many such individual traders,investors or Brokers who cant bear the loss due to their maximun exposure to stock market without proper analysis.This Financial loss leads to mental stress and many a times causes Heart Attacks (some minor,some severe and fatal).

We are in the stock market to make money and not suicide by exposing ourselves to Heart Attacks.

Today is WORLD HEART DAY! Lets vow not to take too much stress from this financial Volatility and be fit and fine.After all Health is Wealth.

Trade with caution and Trade with Proper Analysis.TECHNICAL ANALYSIS!!

HAPPY NAVRATI TO ALL INVESTORS AND TRADERS - KEDAR K MURDESHWAR

28th Sept,2011 Wednesday

TODAY'S CLOUR IS BLUE


MAY THE GODDESS BLESS U AND HELP US MAKE THE RIGHT INVESTMENTS IN THE RIGHT MANNER!

During the nine days of Navratri there is a custom of wearing different colour dress.-Sarees (Sari) and Churidhar – mainly in Gujarat and Maharashtra.

The nine Navratri colors for 2011 are

Pratipada - September 28, 2011 (Wednesday) -BLUE

Dwitiya/Tritiya - September 29 (Thursday) -YELLOW

Chaturthi - September 30 (Friday) - GREEN

Panchami - October 1 (Saturday) - GREY

Sashti - October 2 (Sunday) - ORANGE

Saptami - October 3 (Monday) -  WHITE

Ashtami - October 4 (Tuesday) - RED

Navami - October 5 (Wednesday) -PURPLE

Vijayadasami - October 6 (Thursday) - PINK

Daily Market Update and Overview for Tomorow - Kedar K Murdeshwar

28th Sept, 2011 Wednesday

Sensex: 16453.23
Nifty: 4945.90

MCX Gold: 26191 (up bt Rs 4)
INR-USD: 49.18 (down by -0.44)

Dow: 11190.69 (up 1.33%)
Nasdaq: 2546.83 (up 1.20%)
CAC: 3025..54 (up 0.07%)
Hang Seng: 18011.06 (down 0.66%)
DAX: 5632.83 (up 0.08%)

Todays Nifty Top Gainers were HCL Tech (3.43%),DLF (2.78%) and NTPC (2.35%)
Today's Top Nifty Losers were Rel Capital (-7.17%),JP associates (-5.24%) and RelInfra (-4.78%)

Tomorow's Market Overview (for 29th Sep,2011)

Nifty Support levels for Tomorow:4908,4869 and 4820
Nifty Resistance levels for Tomorow: 4995.5044 and 5083

Buy Calls for Tomorow are as Follows

Buy Amtek India.Targets for Tommorow are 136 and 140
Buy FMGoetze.Targets are 245 and 250
Buy GSPL and Targets for Tomorow are 106/107
Buy Jisljaleqs.Targets for tomorow are 156 and 158.
Buy Hcltech:Targets for Tomorow are 412 and 417


Stock Market Awards - Kedar K Murdeshwar

28th Sept,2011 Wednesday

The Unique Indian Stock Market Awards

The Best Stock in Nse - DEN Networks
(Gained 66.38% from the previous Month.Opened at 40.60 this month and is currently Trading at 68.80.If one had invested Rs 50000 one month ago,the amount today would have been  Rs 76927)

The Next Best Stock (Supporting) in NSE - RUSHIL
(Gained 41.24% from the previous month.Opened at 135 this month and is currently trading at 189.90.If one had invested Rs 50000 one month ago it would have been Rs 75913)

The Worst Stock in NSE - Fortis
(Lost -19% from the previous month.Opened at 153.60 this month and is currently trading at 123.90)

The Next Worst Stock in Nse - Sudar
( Lost -16.82% from the previous Month.Opened at 82 this month and is currently trading at 68.25)

Tuesday, 27 September 2011

Daily Market Update and Overview for 28th Sep 2011 - Kedar K Murdeshwar

27th Sept,2011 Tuesday

Sensex: 16524.03 (472.93 pts up)
Nifty: 4971.25 (135.85 pts up)

Gold (MCX): 26671 (984 pts up)
INR-USD: 49.62

Dow: 11043.83
Nasdaq: 2516.69
CAC: 2955.51
HangSeng: 18130.55
DAX: 5539.62

Overview for Tomorrow (28th Sept,2011)

Nifty opened higher today and closed near its high indicating bullishness.The Upper target levels for Nifty for 28th Sept are 5005,5033 and 5083.
The support levels for tomorrow are 4928,4878 and 4850.

My personal opinion is that If Nifty crosses and Sustains above 4985,then it can reach and touch 5059 and 5109 before coming down fron this level.

All the scrips in Nifty were positive except 3 scrips.Cipla (-0.47%),BPCL (-0.33%) and Sun Pharma (-0.13%).

Good stocks to Buy for tomorrow are

Buy DLF,if it crosses 217.The Intraday upper targets for DLF are 222 and 227
Buy Tata Motors with a Target of 161 and 163
Buy Reliance with a Target of 825.
Buy TCS with a Target of 1065

Monday, 26 September 2011

Daily Market Updates and Tommorow's Overview - Kedar K Murdeshwar

26th Sept,2011 Monday

Today's Update

Nifty:4835.40 (-32.35 pts down)
Sensex:16051.10 (-110.96 pts down)

Gold: 25940 (-776 pts down) (MCX)
INR-USD: 50.54

Dow: 10771.48
Nasdaq: 2483.23
Hanseng:17407.80
CAC:2867.30
FTSE:5093.95

Overview

This week opened weak.

The Intraday support levels for Nifty for 27th Sept,2011 are 4768,4702 and 4647
The Intraday resistance levels for Nifty for 27th Sept,2011 are 4888,4944 and 5009

Nifty may be Volatile tomorow.

4720 is Crucial Bottom Support

Sterlite (-4.53%),Sesa Goa (-4.37%),Reliance Capital (-4.20%) were the Draggers for Nifty
DLF (3.72%),JpAssociate (3.12%),Ranbaxy (2.18%) were positive today in Nifty

Calls For Tomorrow (27th Sept 2011)
Bank Of Baroda:Target 815,Union Bank:Target 252
Buy Ranbaxy only above 483.Target: 488
Buy Mundra Port,Target:155


Bollinger Bands Lets Learn - Kedar K Murdeshwar

26th Sept,2011 Monday

Bollinger Bands:The Bollinger Bands consist of 2 bands,1 upper and 1 lower.These bands are plotted above and below the 20 day Simple Moving Average as these bands are standard Deviation of 2% calculated from the 20 day moving average.

I know the upper part was too technical.Lets keep it simple.Follow some of my strategies given below.

1) Go Long when the price crosses and give a close above the Upper band.
2) Go Long when the Price cuts and gives a close above the 20 day SMA
3) When the previous day's candle has given a close below the lower band and the next candle or the current candle closes above the lower band,Go Long

In the Given Below Daily Chart Of Gold one can see all the 3 strategies


For Further Details and Studying in depth on such strategies mail me at kd_analyst@rediffmail.com

Sunday, 25 September 2011

Moving Averages - Kedar K Murdeshwar

26th Sept,2011 Monday

Moving Averages:The simplest and the Crucial Indicator in Technical Analysis is a Moving Average.Moving Averages help is Identifying a Trend,Enter and Exit Signals and act as Resistance and Support.

There are different types of averages like simple,Exponential and weighted averages,which I am not elaborating here.(To save my Training Business!)

The simplest strategies used are Buy, when a Short term Average say (50 days SMA ) crosses a Long Term average (200 day SMA) upwards and Vice versa.

Another Strategy is to Buy, when the price itself crosses either of the averages upwards and vice versa.

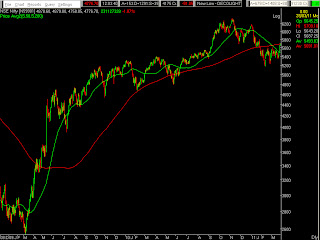
In the Given below chart of Nifty,the 50 day SMA had cut the 200 day SMA downwards on 4th march 2011 and the rest is history.The green line is the 50 day SMA and the red line is the 200 day SMA.


In the same manner the 50 day SMA had cut the 200 day SMA upwards on 26th May 2009 and the Nifty Rallied upwards.This can be seen from the given below figure.The green line is the 50 day SMA and the red line is the 200 day SMA

Nifty Morning Update - Kedar K Murdeshwar

26th Sept,2011 Monday

Market Overview as at 11.45 am (Nifty at 11.45 am was 4780)

Nifty looks more bearish as I had predicted on Friday Evening.As of now,I would say 4720 is the crucial support for Nifty and this can be touched either today or Tomorrow.

On the other hand,till date there had been 4 bearish sessions indicating one more bearish session is required to complete the short term downtrend at least as of now on a temporary basis.(based on Fibonacci logic,after a downtrend of 5 days the market can reverse)

I still say that if this reversal happens it can be a 1 or 2 day reversal as the bearishness is spread all over.

The next 1 hour can show some bounce back

Saturday, 24 September 2011

Industry Analysis - Distilleries - Kedar K Murdeshwar

24th Sept,2011 Saturday

Weekly Industry Analysis (This week's Industry is Breweries and Distilleries)

EDL:The scrip closed at 91.95.The weekly close was below last week's doji bottom indicating further bearishness.Support levels for next week are 85 and 79.

IFBAgro:This scrip looks good and it closed at 136.05 on NSE.The resistance levels for next week are 143 and 150.The support levels are 128 and 121.

RKDL:This scrip looks positive for next week.The last close was 17.90.

Friday, 23 September 2011

Anil Ambani Group Technical Analysis - Kedar K Murdeshwar

24th Sept,2011 Saturday

Weekly Business House Stock Updates as per Technical Analysis

Anil Ambani Group (Weekly Update)

RBN:The stock closed at 84 this week and has formed a Doji Formation.If the next week closes above the high of this Doji,the stock may rally.Anything below this Doji bottom is dangerous.The major resistance for RBN is 105 in the medium term.The support levels for next week are 80 and 77.The near upper target for next week are 88 and 92.

RCOM: The stock closed at 79 on Friday.The stock looks bearish for the next week.The support levels are 74 and 70.

Rel Capital:The stock closed at 402.Another Doji formation on the weekly chart.The nest week's close above or below the high or Low of this Doji will decide the fate of the stock.The Support levels for next week are 386 and 370.The upper Resistance levels for next week are 421 and 435.

RelInfra:The sock opened below this week and ended lower at 428.40.A complete bearish candle on the weekly chart.Looks Bearish.Support levels for next week are 410 and 396.The Resistance levels are 453 and 470.In the Medium term 517 is a very strong resistance.

Rel Media:This week made a higher top and a higher bottom but ultimately closed down.May move up.The Target levels for next week are 110 and 116.The support levels for next week are 93 and 85.

RNRL:This stock opened with a gap up this week and the gap is unfilled.That means the stock has a major support at its unfilled gap of 41.Again there is a doji formation on the weekly chart indicating the the stock may rally only when it close above the doji high.Upper targets for next week are 44 and 45.This stock is major resistance at 51 in the medium term.

Rpower:This stock has closed above in the last week and also filled the downward gap of previous two weeks.The stock closed at 81.85.The stock looks good for next week and the target levels are 85 and 88.The support levels for next week are 77 and 72


Currency Update and View for Next week - Kedar K Murdeshwar

24th Sept,2011 Saturday

Currency Updates (for the next week)

US Dollar:On 23rdSept it closed at 50.01.I had predicted a Resistance near 49.50 and 49.60,from where the Rupee will appreciate.This time I would like to make a point that Rupee may still depreciate to 50.22 in the coming week.

UK Pound:Rupee has depreciated against the UK Pound and closed at 77.17 on Friday.However,the UK Pound is near to its resistance of 77.48.The Rupee may depreciate to this level in the coming week.

NZ Dollar:The rupee appreciated against NZ Dollar to close at 39.49 on Friday.The rupee may Still appreciate against the NZ Dollar

EURO:The Rupee continues with its Depreciation against Euro and close at 67.57 on Friday.It may depreciate further in the coming week and has a resistance 68.64.

Weak Rupee

23rd Sept,2011 (Friday)

Weak Rupee!How will it Affect Indians (Source Rediff)

If you are an Indian professional and earning in dollars, here is some good news.
You have got a salary rise of eight per cent, in rupee terms, in the past one month.
In other words, if you were earning $2,000 or Rs 91,500, your salary is now Rs 99,120.
 Only, such professionals will also have to pay more tax, warns Homi Mistry, tax partner, Deloitte, Haskins & Sells.

The liability on the additional income will be an additional Rs 2,286 for a person in the highest income tax bracket, as it will be India-sourced income.
On September 22, the rupee closed at 49.56 from 48.35 a dollar a day earlier. And, bankers are not bullish about the rupee in the near future.
The first thing to be hurt will be investments.
Certified financial planner Arnav Pandya says if you hold stocks of companies in oil and gas, infrastructure, fertiliser or the tyre business, your returns will take a hit: These companies will fall when the rupee falls.
They procure their raw material from abroad, for which they now need to pay more

At the same time, if you have exposure to information technology and export-oriented companies, you will benefit because the depreciating rupee improves their top line.
So, too, with investments in mutual funds with foreign exposure, like an Indo-China fund. "Returns dip when converted into rupees. The net asset value of feeder funds is also impacted as you buy units in rupees when the underlying (asset) of the fund is bought in foreign currency," says Pandya.
"Students going abroad may have to pay a higher equated monthly instalment towards an education loan," says S Govindan, general manager, personel banking & operations, Union Bank of India

He says depreciation is factored into education loans, thereby helping students in such situations.
Travelling abroad has become more expensive.
Tour operators say foreign travel cost can easily go up by at least 10 per cent in such a scenario.
A large part of this would depend on your miscellaneous expenses. If you heavily depend on credit card(s) for shopping and dining abroad, you would be better off using cash at such times.

Today's Market Summary and OverView for 26th sept,2011 - Kedar K Murdeshwar

23rd Sept,2011 Friday

Market Update
Sensex: 16162 (-199 points down)
Nifty: 4867.75 (-55.90)
Dollar: 50.01 (1.04)
Gold: 27562 (-353 points down)

Support and Resistance levels for Nifty for Monday (26th Sept,2011)

Support: 4820,4774 and 4719
Resistance/; 4920,4975 and 5021

Nifty ended -1.18% from yesterday and was down -4.30% from last week

Nifty may open down on Monday and may bounce back in the later hours.

The best stocks in NSE today were WSI (15.15%),NagreekExp (14.51%) and Neclife (12.24%)
The worst stocks in NSE today were Sanwaria (-15.75%),UcalFuel (-9.64%) and Apaper (-9.34%).

Nifty Pullers and Draggers
Draggers: TataPower (-5.46%),Hindalco 9-3.95%) and Cairn (-3.47%)
Pullers : Rpower (3.43%),Cipla (2.25%) and Grasim (2.07%)

Buy Calls For Monday: Dynamatech Target 1064///Concor Target 945///Ruchi Soya Target 119///Sterlite Biotech Target 80///Ipca Labs Target 278


Thursday, 22 September 2011

GAP RSI THEORY - By Kedar K Murdeshwar

23rd Sept,2011

Strategy Name:Gap Rsi Theory

RSI (Relative Strength Index) is an oscillator that oscillates around overbought zone and oversold zone of 70 and 30.The General strategy as per books is to buy when the RSI exits Oversold zone and Sell/short when the RSI exits Overbought zone.The Default RSI parameters are 14,E,9 RSI.

However in my 10 years of experience I have come across many indicators and RSI has always been one of my favourites.I have developed Many Strategies with RSI which I teach  my students (of course not Free!)

But I would Like to share one of the Strategies with you and that is Gap Rsi Theory

I have changed the parameters of RSI  and made it a smoothed RSI.The Theory is,whenever the smoothed RSI exits the overbought Zone and there is a downward gap,one should short the next day (of course, looking at the market conditions)(Downward Gap means today's high is less than yesterday's low)

The same for going long.Go Long when the Smoothed Rsi exits oversold zone and there is an upwards gap.(Upward gap:Today's low is Greater than yesterday's high)

The RSI parameters are 5,E,3 smoothed by Average E7.Overbought and Oversold zones are 80 and 20

In the given below chart of Hindalco see the downward movement after the formation of this Strategy

International Markets:Morning Update - Kedar K Murdeshwar

23rd Sept,2011 (Friday Morning International Updates)

The International scenario is Bearish.

Dow: 10733

Nasdaq:2455.67

DAX:5164.21

Nikkie:8560

Hangseng:17625.60

FTSE:5041.61

CAC:2781.68

International Commodities Market

Crude: 80.89

Silver:3625

Gold:1745


Market Summary and Overview for Tomorrow - Kedar K Murdeshwar

22nd Sept,2011 (Thursday)

Nifty (Intraday close:4918.10) (-215 points down)
Sensex was down by 704 points and closed at 16361
Gold: 27912 (MCX) Down by 229 points
Dollar:48.96


Nifty opened gap down today.It has given a downward breakout from a symmetrical triangle formation.Nifty can open below tomorrow for touching the level of 4893 a crucial support.

Nifty overview for Tommorw (23rd Sept,2011)

Given below are the Crucial Intraday Levels for Trading.Nifty would try the upper levels given below if its is above 4961 and will try to test the lower levels if is below 4961

The Support levels for Tomorrow are 4863,4809 and 4711
The Resistance levels for Tomorrow are 5016,4907 and 4918

Today's Summary

All the 50 stocks ended negative.
Jpassociates (-9.81%) and Rcom (-8.26%) were the Top Losers today

Overview for Tomorrow (23rd September 2011)

Reliance still looks bearish and can try to touch its crucial support of 759.The stock is currently trading at 780 as on NSE.

TCS looks bearish for Tomorrow.Support levels are 976 and 957
Wipro looks Bearish for Tomorrow and the support levels are 334 and 327

DLF Waiting to touch its support level of 188.Currently trading at 196.50


Cnx Energy - Ascending Triangle - Kedar K Murdeshwar

22nd Sept,2011 Thursday (at 2.00 pm)

CNX Energy:In the Given below Daily Chart of Cnx Energy Chart a Formation of Ascending Triangle can be seen.The energy Chart has given a downward breakout from the ascending Triangle.Currently it is at 7701.
Reliance,NTPC,Cairn and Rpower are top Draggers in this Index Today.(as at 2.00 pm)

BPCL and IOC are Marginally up.


Wednesday, 21 September 2011

Currency Dollar Outlook - Kedar K Murdeshwar

22nd Sept,2011 Thursday at 10.00 am

As I had predicted,Rupee is depreciating more and I think My prediction given on 19th Sept will be right.Once again I am reminding you all Rupee will not appreciate until and unless it touches 49.60/49.58

Yesterday's Dollar was 48.81.

Nifty Opening at 9.30 am - Kedar K Murdeshwar

22nd Sept,2011 Thursday (at 9.30am)

Nifty has opened wit a gap today.On the daily chart is looks as if Nifty has formed a Symmetrical Triangle. (Joining a trendline from the highs of 5th Aug and 8th Sept and the lows of 26th Aug and 14th Sept).

I think Nifty will try to take a support at this upward sloping trendline in Intraday.Nifty has an immediate Intraday Support at 5034.Lets hope if Bounces back from here.The next Support is 5020.

Nifty and Nifty stocks Overview for tomorow - Kedar K Murdeshwar

21st Sept,2011 (Wednesday)

Nifty (Intraday Close:5128.75)
Sensex(Intraday Close:17052.14)


Nifty Closed below today at 5128.75 -11 points down from previous close.Nifty could not break above the steepline of Inverted Head and Shoulder pattern.Nifty still looks bearish.I still maintain that even if tomorrow Nifty is able to cross above the Steep Line and comfortably close.If this does not happen,then the Inverted Head & Shoulder pattern will fail.

Crucial level to watch for Nifty is 5135.If nifty is hovering around the following levels then given below are the

Support Levels for Tomorrow for Nifty: 5102 and 5077
Resistance levels for Tomorrow for Nifty: 5161 and 5194

Tomorrow Overview of Stocks for 22nd Sep,2011

Axis Bank, as per my prediction went up today.Axis bank may still rise if it is above 1159 tomorrow.

Hero Honda looks Bearish tomorrow.

Infosys,Rel Capital and IDFC are showing doji formation that is indecision.

PowerGrid may jump up tomorrow if it is above 99 tomorrow.

Sesa Goa is maintain its support of 217 for last one week.Maybe its waiting for a correct signal to shoot up

Bank Index and Bank Stocks - Kedar K Murdeshwar

21st September,2011 posted at 2.45 pm (During Market Hours)

Bank Index and Bank Stock today: Viewers who are new can visit my earlier blog posted on 16th september 2011.I had predicted the upmove and the Index is respecting my views.Today the entire market is down but the Bank stocks are up thanks to my prediction of Bank Index.

The CNX Bank index has crossed the neckline of inverse head & shoulders pattern yesterday on 20th September 2011.The result is in front of all of us.Yesterday Cnx Bank closed at 9812.70.

Today it touched a high of 9962.I hope all my viewers remember my prediction of Bank Index touching the target of 10300 in the coming days.

Bank Of Baroda and ICICI Bank and SBI are the front runners.

PNB is the only loser.

Bearish Engufing - Lets Learn - Kedar K Murdeshwar

21st Sept,2011

Bearish Engulfing:This is a Bearish pattern occurring in an uptrend.A green candle is completely engulfed by a Big red candle.The logic behind this formation is simple.After a bearish day,the next day the market opens higher but cannot sustain the rally and close below yesterdays low.

This pattern must be formed after a huge upward rally.the formation of this pattern in a flat market loses its charm.One can see it as a Mirror Image of Bullish Harami.

In the given below daily chart of SBI a Bearish Engulfing can be seen and also the downfall after that.


For more Information mail me on kd_analyst@rediffmail.com

Bullish Harami - Lets Learn - Kedar K Murdeshwar

21st Sept,2011

Bullish Harami:In a downtrend a Green candle appears after a Red Candle in such a way that the Green Candle's body is completely contained in the Red Candle's body.

It's a 2 candle pattern and a reversal pattern.One has to buy on the 3rd candle after the first 2 candles.The average traded price of the 2nd green candle can be considered as the entry stop loss.

The success ratio of this candle pattern is 65% to 70%

In the Given below  Daily chart of JP associates,one can see a Bullish Harami Pattern and the stock rallied upwards after this candle formation.

For more details mail me on kd_analyst@rediffmail.com

Tuesday, 20 September 2011

Nifty over view for 21st September - By Kedar K Murdeshwar

20th Sept,2011

Nifty:Intraday close was 5148.90.As I had predicted earlier Nifty has completed an Inverted Head & Shoulders Pattern on the daily chart waiting for an upward breakout.If this happens,Nifty will straight away move up before stopping at 5323.The Intraday support levcels for Nifty are 5072 and 4996.

Axis Bank:Buy above 1130 and looks good.Target is 1160.

Bharti Airtel looks Good as the smoothened rsi is giving a buy signal.Buy above 391 and target 395/396.

Dr Reddy:Can be a good buy not only for Intraday but also for 2-3 days.Target for Tommorow 1548 and Target for 2-3 days 1556.

Hindalco:One can buy tommorow if above 148.Target for tommorow is 153.Target for 2-3 days is 163 on the upside

Hind Unilever:Is on the verge of Forming Cup and Handle formation and can rally up if it breaks above 346.Then the target can be 356