26th Sept,2011 Monday
Moving Averages:The simplest and the Crucial Indicator in Technical Analysis is a Moving Average.Moving Averages help is Identifying a Trend,Enter and Exit Signals and act as Resistance and Support.
There are different types of averages like simple,Exponential and weighted averages,which I am not elaborating here.(To save my Training Business!)
The simplest strategies used are Buy, when a Short term Average say (50 days SMA ) crosses a Long Term average (200 day SMA) upwards and Vice versa.
Another Strategy is to Buy, when the price itself crosses either of the averages upwards and vice versa.
In the Given below chart of Nifty,the 50 day SMA had cut the 200 day SMA downwards on 4th march 2011 and the rest is history.The green line is the 50 day SMA and the red line is the 200 day SMA.

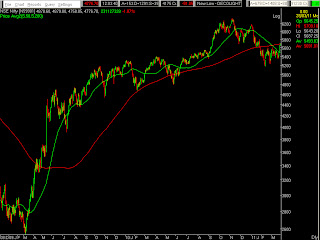
In the same manner the 50 day SMA had cut the 200 day SMA upwards on 26th May 2009 and the Nifty Rallied upwards.This can be seen from the given below figure.The green line is the 50 day SMA and the red line is the 200 day SMA
Moving Averages:The simplest and the Crucial Indicator in Technical Analysis is a Moving Average.Moving Averages help is Identifying a Trend,Enter and Exit Signals and act as Resistance and Support.
There are different types of averages like simple,Exponential and weighted averages,which I am not elaborating here.(To save my Training Business!)
The simplest strategies used are Buy, when a Short term Average say (50 days SMA ) crosses a Long Term average (200 day SMA) upwards and Vice versa.
Another Strategy is to Buy, when the price itself crosses either of the averages upwards and vice versa.
In the Given below chart of Nifty,the 50 day SMA had cut the 200 day SMA downwards on 4th march 2011 and the rest is history.The green line is the 50 day SMA and the red line is the 200 day SMA.

In the same manner the 50 day SMA had cut the 200 day SMA upwards on 26th May 2009 and the Nifty Rallied upwards.This can be seen from the given below figure.The green line is the 50 day SMA and the red line is the 200 day SMA

No comments:
Post a Comment